
Approximate the area under two curves in R
Let’s say we have two curves, there is some overlap between them, and we want to calculate the amount of area of overlap.
x <- seq(-2,2,0.001)
y1 <- dnorm(x, 0, 1)
y2 <- dnorm(x, -1,1)

# plot them out
plot(x,y1, type = "l", bty = "l", lwd = 2, las = 1, ylab = "y")
lines(x,y2, col = "red", lwd = 2)
text(x = -0.5, y = 0.1, labels = "The area here!", cex = 1.2)

One way we can do this is with some numerical integration (assuming we have a sufficient number of points for both curves). Here, we are going to identify 1) the area under the two curves and 2) the total area of the two curves so that we can approximate the amount of overlap. To do so, we need to find the minimum and maximum y-axis values between the two curves for each value of x.
# vectors to store the area under the curves and the total
# under = min of the two vlues
# total = max of the two values
auc <- rep(NA, length(x))
total <- rep(NA, length(x))
for(i in 1:length(auc)){
  auc[i] <- min(c(y1[i], y2[i]))
  total[i] <- max(c(y1[i], y2[i]))
}
# add zeroes to start and end of both vectors
# so that the y values and x values meet at the
# bottom
auc <- c(0,auc,0)
total <- c(0, total, 0)
# repeat the min and max of x for this reason
x_area <- c(min(x), x, max(x))

# Plot them out
par(mfrow = c(1,2))
plot(x,y1, bty = "l", type = "n", las = 1, main = "Total area")
polygon(x_area, total, col = "purple")
lines(x,y1, col = "black", lwd = 5)
lines(x,y2, col = "green", lwd = 5)

# plot area under the curves
plot(x,y1, bty = "l", type = "n", las = 1, main = "Area under curves")
polygon(x_area, auc, col = "blue")
lines(x,y1, col = "black", lwd = 5)
lines(x,y2, col = "green", lwd = 5)

The next thing we do is put together a function to calculate the area of the two polygons we identified with the code above from their respective x and y values. Once we do that, we can divide them to find the proportion of overlap.
# a function to calculate area from xy coords
# via a contour integral.
area<-function(X){
  X<-rbind(X,X[1,])
  x<-X[,1]
  y<-X[,2]
  lx<-length(x)
  abs(sum((x[2:lx]-x[1:lx-1])*(y[2:lx]+y[1:lx-1]))/2)
}

# area under the two curves
auc_area <- area(cbind(x_area, auc))
# equals 0.5929751

# total area
total_area <- area(cbind(x_area, total))
# equals 1.201519

# proportion overlap, about 50%
auc_area / total_area
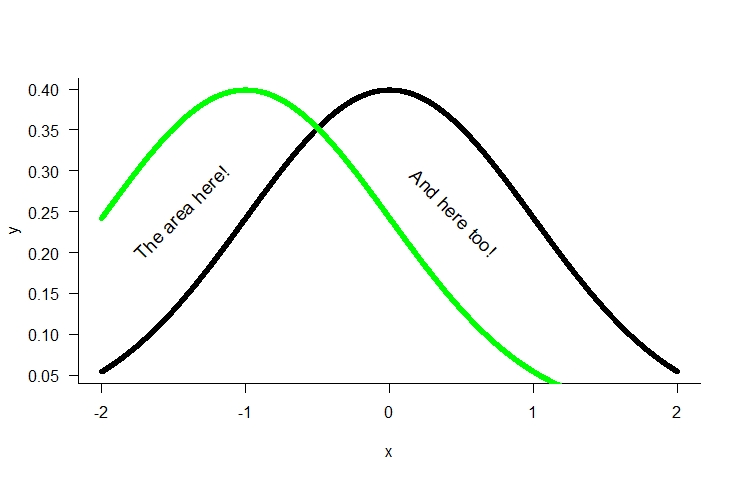
So there is about 50% overlap between these two curves. However, let’s double check our work. We can also pretty easily calculate the area between these two curves as that is the integral of the difference between them. The area between the two curves is this section of the plot here:
# check work, calcualte area between the curves
f1 <- approxfun(x, y1-y2)
f2 <- function(x) abs(f1(x))

# area between the two curves
b2c <- integrate(f2, -2, 2)

# This should equal the total area
b2c$value + auc_area
# equals 1.201519

# compare to total_area, they are the same!
total_area
# 1.201519
And here is all the code together so you can copy it at once if you’d like. I had some help from these two posts here (the area function, the area between two curves integration).
# Calculate the amount of overlap between two distributions in R
x <- seq(-2,2,0.001)
y1 <- dnorm(x, 0, 1)
y2 <- dnorm(x, -1,1)

# plot them out
plot(x,y1, type = "l", bty = "l", lwd = 2, las = 1, ylab = "y")
lines(x,y2, col = "red", lwd = 2)
text(x = -0.5, y = 0.1, labels = "The area here!", cex = 1.2)


# vectors to store the area under the curves and the total
# under = min of the two vlues
# total = max of the two values
auc <- rep(NA, length(x))
total <- rep(NA, length(x))
for(i in 1:length(auc)){
  auc[i] <- min(c(y1[i], y2[i]))
  total[i] <- max(c(y1[i], y2[i]))
}
# add zeroes to start and end of both vectors
# so that the y values and x values meet at the
# bottom
auc <- c(0,auc,0)
total <- c(0, total, 0)
# repeat the min and max of x for this reason
x_area <- c(min(x), x, max(x))

# Plot them out
par(mfrow = c(1,2))
plot(x,y1, bty = "l", type = "n", las = 1, main = "Total area")
polygon(x_area, total, col = "purple")
lines(x,y1, col = "black", lwd = 5)
lines(x,y2, col = "green", lwd = 5)

# plot area under the curves
plot(x,y1, bty = "l", type = "n", las = 1, main = "Area under curves")
polygon(x_area, auc, col = "blue")
lines(x,y1, col = "black", lwd = 5)
lines(x,y2, col = "green", lwd = 5)

# a function to calculate area from xy coords
# via a contour integral.
area<-function(X){
  X<-rbind(X,X[1,])
  x<-X[,1]
  y<-X[,2]
  lx<-length(x)
  abs(sum((x[2:lx]-x[1:lx-1])*(y[2:lx]+y[1:lx-1]))/2)
}

# area under the two curves
auc_area <- area(cbind(x_area, auc))
# equals 0.5929751

# total area
total_area <- area(cbind(x_area, total))
# equals 1.201519

# proportion overlap, about 50%
auc_area / total_area

# Area between the two curves plot
plot(x,y1, type = "l", bty = "l", lwd = 5, las = 1, ylab = "y")
lines(x,y2, col = "green", lwd = 5)
text(x = -1.45, y = 0.25, labels = "The area here!", cex = 1.2,srt = 45)
text(x =0.45, y = 0.25, labels = "And here too!", cex = 1.2, srt = -45 )

# check work, calcualte area between the curves
f1 <- approxfun(x, y1-y2)
f2 <- function(x) abs(f1(x))

# area between the two curves
b2c <- integrate(f2, -2, 2)

# This should equal the total area
b2c$value + auc_area
# equals 1.201519

# compare to total_area, they are the same
total_area
# 1.201519